Canva Craft Journal
Canva Craft Infographics: A Workflow for Layout, Labels, and Data
Create a Canva Craft infographic concept with a clear reading order. Use an original prompt, keep charts editable, and check labels before publishing.
Create an image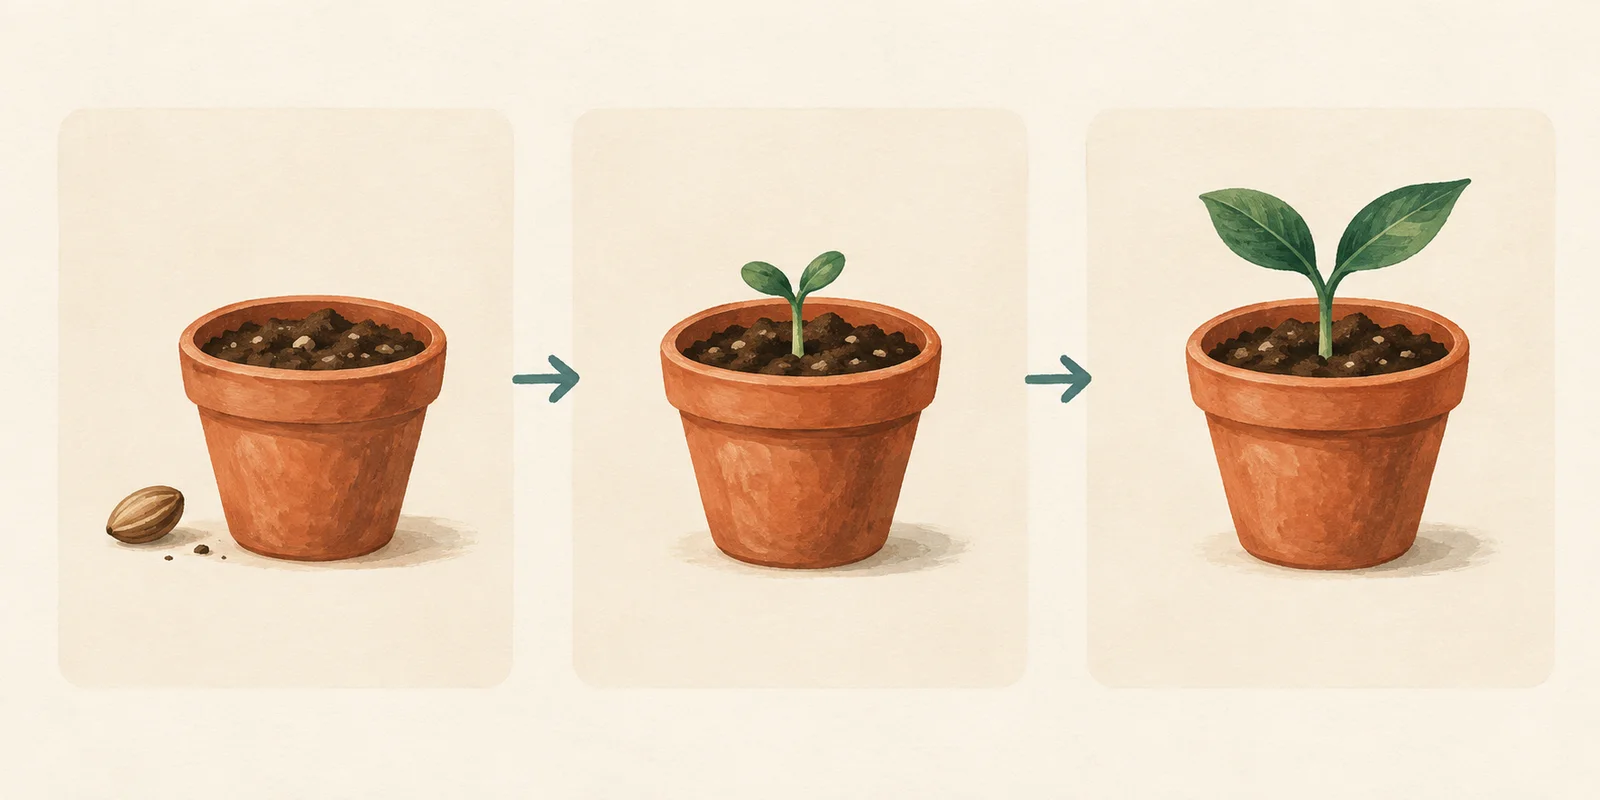
A Canva Craft infographic starts with a message and a reading order. For a short process explainer, describe the panels, illustrations, and spaces for labels. For a report containing figures, build the chart from checked data and use generated imagery around it. A convincing-looking image does not establish that its numbers are correct.
This guide uses a seedling-workshop concept to show how to separate visual generation from information that needs precise editing. You can prepare the visual brief beside the Canva Craft image generator, then finish the labels in a design editor. The prompt below is a suggested starting point, not a recorded Craft performance test.
What Craft contributes to an infographic
In its Craft announcement, Canva describes a planning stage that organizes elements, spatial relationships, scale, visual hierarchy, and text before rendering. Canva also names infographics among the template types used in training. These are reasons to specify a composition clearly; they do not establish automatic fact-checking or exact chart geometry.
Think of the output as a visual asset whose information you still review. If a team needs to change a date, translate a caption, or replace next month's figures, keeping those items editable makes the next revision easier.
Choose the workflow by what your reader must learn:
| Your deliverable | What to ask Craft to generate | What to prepare separately |
|---|---|---|
| A three-stage process explainer | Coordinated illustrations, clear panel order, space for captions | Approved step labels and any detailed instructions |
| An illustrated comparison | Matching visual treatments and consistent spaces for two options | The comparison criteria and verified claims |
| A survey or sales summary | A supporting illustration or quiet background | A chart created from the actual dataset, units, and source note |
| A diagram that will change frequently | Reusable decorative artwork | Editable boxes, connectors, labels, and revision dates |
Canva's graph maker provides charts with editable data. Use that kind of data-based tool when bar lengths, values, or category counts carry the argument. Generating a picture of a chart is a different operation from plotting supplied values.
Start with a content map
Before writing a prompt, list the message, audience, and information blocks. For this example, the deliverable is a landscape visual for a fictional beginner seedling workshop. It explains the order of activities; it does not claim a measured germination timeline.
The approved content map is deliberately small:
| Element | Content decision |
|---|---|
| Main message | A simple progression from a seed to a young plant |
| Reading order | Three panels, left to right |
| Visual sequence | Soil and seed; small sprout; larger seedling |
| Labels to add in the editor | “Start with a seed”, “Watch it sprout”, “Care for the seedling” |
| Details excluded from the visual | Species-specific timing, watering quantities, and care instructions |
This distinction matters. An illustration can communicate sequence without supplying evidence about how quickly a particular plant grows. If the final handout includes practical care advice, check that advice for the actual species before adding it.
Original AI-generated concept illustration made for this guide. It demonstrates panel order and visual consistency; it is not a Craft output, a screenshot, or a botanical timing reference. Labels would be added separately in the final design.
Write the prompt around relationships
Tell the model how the information should be arranged, rather than adding a long list of unrelated style adjectives. Keep the same illustration treatment across panels, make the arrows unambiguous, and reserve room for the labels.
Here is an original prompt to adapt:
Create a landscape illustration for a beginner seedling-workshop process infographic. Arrange exactly three evenly spaced panels from left to right. Panel one shows a terracotta pot containing soil, with one seed beside it. Panel two shows a matching pot with a small sprout. Panel three shows a matching pot with a larger seedling. Connect adjacent panels with simple right-pointing arrows. Keep the pots similar in size so the plant progression is easy to compare. Use a warm cream background, restrained teal accents, and a consistent hand-painted illustration style. Leave clear empty areas above and below the illustrations for a headline and short labels to be added later. Do not include words, numbers, logos, or extra panels.
The most useful instructions here define relationships: three panels, one direction, similar pot sizes, and separate label areas. The illustration style supports those decisions. Replace the plant progression with your own process, but keep the number and order of steps explicit.
For a broader explanation of subjects, hierarchy, and revisions, use the Canva Craft prompt guide. This article focuses on the extra decisions an infographic needs: which information the image carries, which information remains editable, and how readers follow the sequence.
Generate the visual, then assemble the information
Open the generation area, choose the text-to-image mode, and paste your brief. Select an available landscape output that suits the destination. Check the settings and displayed credit cost before generating; this guide does not assume a fixed price or an identical set of controls across every entry point.
Inspect the first result against the content map. Count the panels and arrows. Check that each panel depicts a distinct stage, that the arrow direction matches the intended order, and that the label spaces remain usable.
If the basic sequence works, download the image and place it in a design editor. Add the approved headline and step labels as text elements. This workflow does not require the generator to return editable layers. Canva discusses Magic Layers in its announcement, but that does not establish that a particular generation interface exports a layered file.
For a data-led infographic, assemble it differently: make the chart from your checked values first, then add a supporting illustration outside the plot area. Keep decorative arrows, texture, and objects away from axes and labels. Record the source, time period, and unit beside the chart so the graphic remains interpretable after someone shares it without the surrounding article.
Revise the specific failure
An attractive illustration can still fail as an explanation. Name the failed relationship before changing the prompt.
| What you see | A focused correction | When to finish in the editor |
|---|---|---|
| Four panels instead of three | Request exactly three panels and remove secondary scenes | When the layout is otherwise good and one extra illustration can be removed cleanly |
| Arrows branch or point both ways | Request one right-pointing connector between adjacent panels | When you can place simple editable arrows yourself |
| The pots change size dramatically | Specify matching pot dimensions and consistent framing | When a small crop or alignment change solves the mismatch |
| Labels are misspelled or too small | Remove generated text and reserve blank label areas | When exact wording or later translation matters |
| A generated chart does not match the figures | Replace it with a chart built from the source data | Whenever numerical relationships carry meaning |
Avoid changing the palette, illustration style, panel count, and labels all at once. One focused revision makes it easier to see whether the original problem improved. For lettering-specific problems, the poster text troubleshooting guide covers proofreading and editable-copy workflows in more detail.
Check the actual reading size
View the finished graphic at the size readers will see. On a phone, can someone identify the first panel and follow the sequence without zooming? Are captions readable, and does the image still make sense if color differences are difficult to see?
Check the final export against these questions:
- Does every heading, label, arrow, and unit match the approved content map?
- Are any quantities, percentages, or dates traceable to a checked source?
- Do chart lengths and scales come from the data rather than a generated approximation?
- Have you kept important labels and the source note inside the crop?
- Is there a text explanation or useful alt text where the infographic is published?
- Can a colleague update the wording or figures without regenerating the whole graphic?
If the graphic needs a different shape, recompose it before shrinking everything into a narrow frame. The aspect ratio and resolution guide explains the difference between cropping, adding pixels, and changing the composition.
Start with one message and a small number of information blocks. Use Craft to explore how those blocks can look together, keep exact information editable, and publish only after checking the complete design against its source material.
Put your next idea into practice.
Start with a written brief in the image workspace.